
Close print
2026-10-22
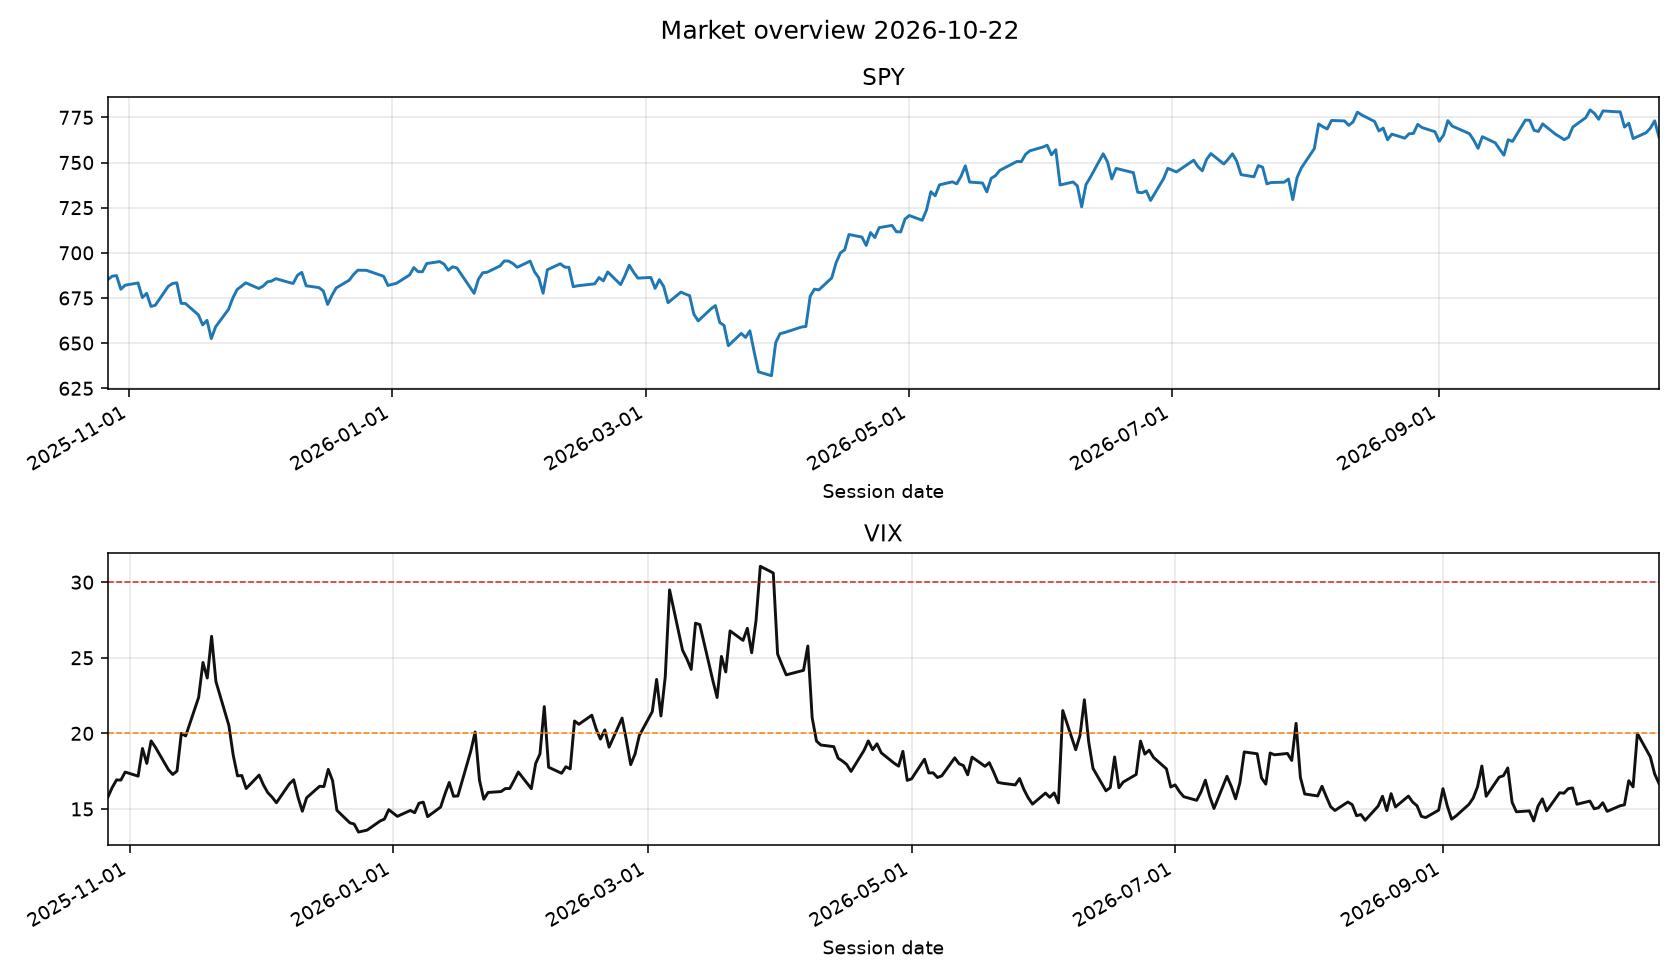
- VIX 16.68 low
- SPY 764.06
- 1 named setups
- Free teaser
Skip-month two
DELL · MRNA
Set 2026-10-15. The two strongest names over about six months, with the latest month left out. Chosen on the last session on or before the 15th and again on the last session of the month. The same pair stays on each daily print until the next one of those sessions. Research, not an order.
DELL Dell Technologies Inc. +247.2% · MRNA Moderna, Inc. +169.7%
Over the measured window — ten years of the local tape, 21 names, onsets spaced so one market phase counts once, and a 10 bps round trip — no named setup beat holding these companies. The unconditional 21-session up-rate was 58.67%. On buy-now versus wait through the next 21 sessions, every setup landed between −0.67% and +0.64% against a random session. One setup clears the publish gate: historic_drawdown at a 61.25% net hit rate on 352 onsets, and its 95% interval bottoms out at 50.33% — a third of a point above a coin. Read that as a gate it passed, not an edge it demonstrated. The desk publishes named setups as context — what happened on the tape — not as timing calls. Scheduled accumulation is the default the evidence supports. The 58.67% figure is not an expected future return: the universe is today's survivors chosen after the fact, which inflates the absolute up-rate.
Earnings note for this close: PE and peer valuation.
hot topics
What the book is talking about
Headlines that piled up on this session. A line is here because the same phrase showed up on two or more watched names, or one name carried three or more headlines. Attention, not a forecast, and not an add.
Chip Stocks Fall
AMD, INTC, LRCX, MRVL · 4 headlines
- AMD Chip Stocks Fall as Supply Warning Deepens AI Selloff: Marvell and AMD Sink 8%, Intel Drops 7%
- INTC Chip Stocks Fall as Supply Warning Deepens AI Selloff: Marvell and AMD Sink 8%, Intel Drops 7%
- LRCX Chip stocks fall as equipment maker Lam Research cites 'supply chain constraints'
- MRVL Chip Stocks Fall as Supply Warning Deepens AI Selloff: Marvell and AMD Sink 8%, Intel Drops 7%
Calls on AMD, Intel, Qualcomm
AMD, INTC, QCOM · 3 headlines
- AMD Susquehanna Makes Strong Calls on AMD, Intel, Qualcomm
- INTC Susquehanna Makes Strong Calls on AMD, Intel, Qualcomm
- QCOM Susquehanna Makes Strong Calls on AMD, Intel, Qualcomm
Fourth Quarter Fiscal
ADI, AMAT, QCOM · 3 headlines
- ADI Analog Devices to Report Fourth Quarter Fiscal Year 2026 Financial Results on Tuesday, November 24, 2026
- AMAT Applied Materials to Report Fourth Quarter and Fiscal 2026 Results on Nov. 12, 2026
- QCOM Qualcomm Schedules Fourth Quarter and Fiscal 2026 Earnings Release and Conference Call
AAPL
AAPL · 7 headlines
- AAPL How much Apple stock does CEO John Ternus actually own?
- AAPL Apple's Most Expensive iPhone Sends Unexpected Signal
- AAPL Better Buffett Stock: Alphabet vs. Apple
- AAPL Good News For Apple Stock Fans
META
META · 7 headlines
- META Meta stock falls 7% as AI spending fears return
- META Stock market today: S&P 500, Nasdaq tanks as tech stocks sink amid AI trade worries, Meta shares plummet
- META Meta stock falls despite Wall Street analysts raising price targets
- META Stock Market Today: Nasdaq-100 Drop Tops 3%; FirstCash, Southern Copper, Meta Lead Sell-Off (Live Coverage)
TXN
TXN · 7 headlines
- TXN Texas Instruments Stocks Slip Despite Broad Chip Recovery
- TXN Tesla Will Make Millions of Optimus Robots. Texas Instruments Can Get Paid on Every One
- TXN Texas Instruments Announces the TI-Rover BT: Bringing Math to Life with a Calculator-Controlled Robotic Vehicle
- TXN UBS Adjusts Texas Instruments Price Target to $360 From $380, Maintains Buy Rating
selloff read
Broad drop or a sector split
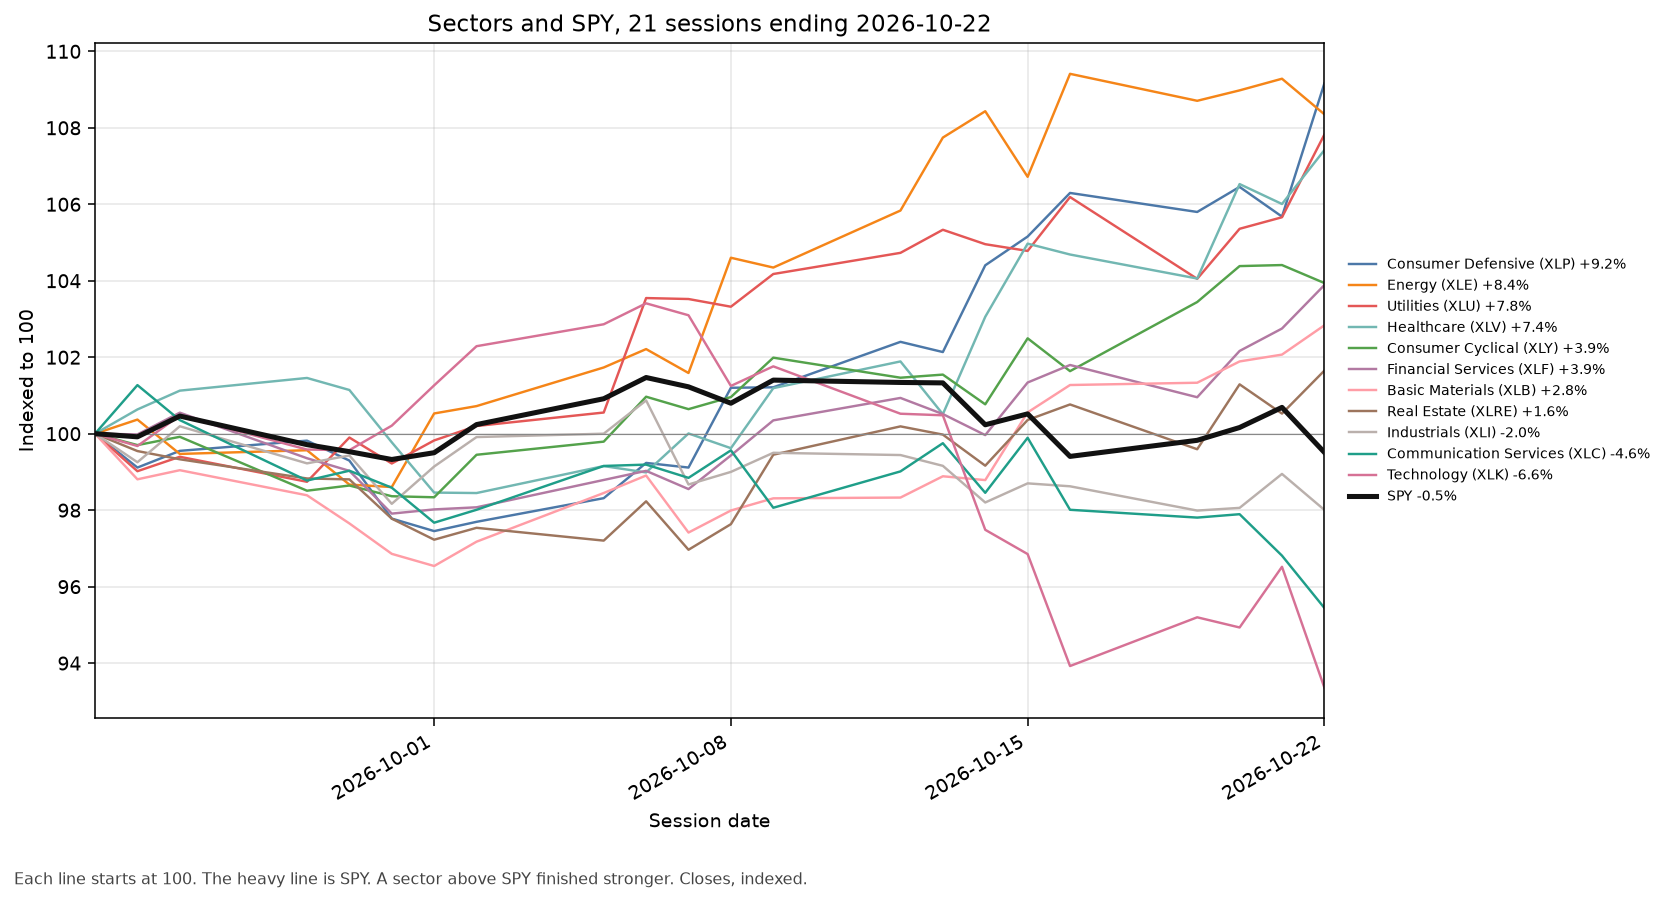
SPY closed -1.2% on the session. Reads whether stored names fell together or sectors split. Each window lists every sector ETF from strongest to weakest. The chart draws SPY and each sector ETF over the last 21 sessions, each indexed to 100 at the start. Not a buy or a sell. Not a named setup.
1 session · rotation
SPY -1.2%. Median name -0.2%. names down 55% (155). sectors down 5/11.
Best XLP +3.3%. Worst XLK -3.3%.
- Consumer Defensive XLP +3.3%
- Utilities XLU +2.0%
- Healthcare XLV +1.3%
- Real Estate XLRE +1.1%
- Financial Services XLF +1.1%
- Basic Materials XLB +0.8%
- Consumer Cyclical XLY -0.5%
- Energy XLE -0.9%
- Industrials XLI -1.0%
- Communication Services XLC -1.4%
- Technology XLK -3.3%
5 sessions · rotation
SPY -1.0%. Median name -0.4%. names down 53% (155). sectors down 3/11.
Best XLP +3.8%. Worst XLC -4.5%.
- Consumer Defensive XLP +3.8%
- Utilities XLU +2.9%
- Financial Services XLF +2.5%
- Healthcare XLV +2.3%
- Basic Materials XLB +2.3%
- Energy XLE +1.5%
- Consumer Cyclical XLY +1.4%
- Real Estate XLRE +1.3%
- Industrials XLI -0.7%
- Technology XLK -3.6%
- Communication Services XLC -4.5%
21 sessions · rotation
SPY -0.5%. Median name +1.2%. names down 48% (155). sectors down 3/11.
Best XLP +9.2%. Worst XLK -6.6%.
- Consumer Defensive XLP +9.2%
- Energy XLE +8.4%
- Utilities XLU +7.8%
- Healthcare XLV +7.4%
- Consumer Cyclical XLY +3.9%
- Financial Services XLF +3.9%
- Basic Materials XLB +2.8%
- Real Estate XLRE +1.6%
- Industrials XLI -2.0%
- Communication Services XLC -4.6%
- Technology XLK -6.6%
Desk take
What we think of this print
Close print for 2026-10-22. VIX 16.68 (low) and SPY 764.06 set the tape. Hybrid desk: the scanner names the setup, the model grades that same print, and published conviction is the blend. The model cannot add a name that did not fire.
Amazon.com, Inc. (AMZN)
Scanner what happened: AMZN traded cheaper than its industry peers on trailing P/E at 88/100 (setup 100).
Why it printed:
- Trailing P/E 20.1 is below the internet retail / big-box peer median 32.5 (38% cheaper).
- Market cap still sits above the peer median ($2.70T vs $389.1B).
- Cap is more than 2× the peer median — quality/size filter.
- VIX regime is low (16.68).
- 21d relative strength vs SPY is 0.9%.
- Relative volume 1.33x.
Invalidation: Multiple re-rates up to the peer median P/E, or a daily close back below SMA200; stop ~236.63.
Continuation of the 2026-10-21 alert, not a new one — this is print 7 of one run: the same call has gone out 6 times since 2026-10-14 across 8 calendar days, most recently on 2026-10-21. Today is not a fresh signal; the setup was already true when the desk last printed it. The analog below measures the first session of a run, so its hit rate belongs to 2026-10-14, not to today.
Same-setup analogs on 21 names (n=266, n_eff=86.5, 95% CI 48–68%): 58% 21-session net hit rate against a 59% base rate, average +3.0%, vs SPY +1.3%.
The 95% interval includes 50%, so this is the desk's narrative setup rather than a demonstrated edge.
LLM confirm at 85/100: The setup identifies a valid valuation discount relative to peer medians while operating in a low VIX regime. Relative strength and volume metrics confirm institutional accumulation behind the move. The defined invalidation level provides a clean structural boundary for risk control.
Risk: A sudden market-wide multiple contraction or a breakdown below the 200-day moving average would invalidate the thesis.
Taiwan Semiconductor (TSM)
Scanner what happened: TSM traded cheaper than its industry peers on trailing P/E at 78/100 (setup 98).
Why it printed:
- Trailing P/E 26.5 is below the semiconductors peer median 46.0 (42% cheaper).
- Market cap still sits above the peer median ($2.14T vs $829.2B).
- Cap is more than 2× the peer median — quality/size filter.
- VIX regime is low (16.68).
- Relative volume 1.27x.
Invalidation: Multiple re-rates up to the peer median P/E, or a daily close back below SMA200; stop ~386.37.
Continuation of the 2026-10-21 alert, not a new one — this is print 11 of one run: the same call has gone out 10 times since 2026-10-07 across 15 calendar days, most recently on 2026-10-21. Today is not a fresh signal; the setup was already true when the desk last printed it. The analog below measures the first session of a run, so its hit rate belongs to 2026-10-07, not to today.
Same-setup analogs on 21 names (n=266, n_eff=86.5, 95% CI 48–68%): 58% 21-session net hit rate against a 59% base rate, average +3.0%, vs SPY +1.3%.
The 95% interval includes 50%, so this is the desk's narrative setup rather than a demonstrated edge.
LLM confirm at 78/100: The print correctly captures a significant P/E discount against semiconductor peers accompanied by strong market capitalization filters. Although short-term relative strength is negative, the broader valuation buffer supports the assigned setup. Volume expansion validates early accumulation phases.
Risk: Prolonged underperformance against the broader market could delay the anticipated valuation re-rating.
Alphabet Inc. (GOOGL)
Scanner what happened: GOOGL traded cheaper than its industry peers on trailing P/E at 73/100 (setup 92).
Why it printed:
- Trailing P/E 16.3 is below the interactive media peer median 18.9 (14% cheaper).
- Market cap still sits above the peer median ($1.90T vs $11.3B).
- Cap is more than 2× the peer median — quality/size filter.
- VIX regime is low (16.68).
- Relative volume 1.12x.
Invalidation: Multiple re-rates up to the peer median P/E, or a daily close back below SMA200; stop ~306.37.
Same-setup analogs on 21 names (n=266, n_eff=86.5, 95% CI 48–68%): 58% 21-session net hit rate against a 59% base rate, average +3.0%, vs SPY +1.3%.
The 95% interval includes 50%, so this is the desk's narrative setup rather than a demonstrated edge.
LLM confirm at 75/100: The stock trades at an attractive discount to interactive media peers within a calm volatility environment. The RSI indicates a washed-out state offering a favorable entry window for mean reversion. Volume metrics support steady sponsorship at these levels.
Risk: Failure to hold support near the indicated stop level could trigger further technical unwinding.
Microsoft Corporation (MSFT)
Scanner what happened: MSFT pulled back to its 20-day average inside an uptrend at 71/100 (setup 90).
Why it printed:
- Price above SMA50 and SMA50 above SMA200 (bullish regime).
- VIX regime is low (16.68).
- RSI_14=50.5 is a reset, not a chase.
- Close is -1.0% from SMA20 (pullback/tag).
- 21d relative strength vs SPY is 4.6%.
- Relative volume 0.93x.
Invalidation: Stop ~498.34 (2x ATR) or daily close back below SMA50.
Same-setup analogs on 21 names (n=1022, n_eff=114.2, 95% CI 51–68%): 60% 21-session net hit rate against a 59% base rate, average +2.8%, vs SPY +1.5%.
The 95% interval includes 50%, so this is the desk's narrative setup rather than a demonstrated edge.
LLM confirm at 72/100: The pullback into the rising moving average structure offers a textbook continuation entry within a primary uptrend. An RSI near neutral highlights a proper reset rather than an overextended chase. Positive relative strength confirms underlying institutional demand.
Risk: Loss of the 50-day moving average would break the bullish market structure and invalidate the trade.
NVIDIA Corporation (NVDA)
Scanner what happened: NVDA traded cheaper than its industry peers on trailing P/E at 72/100 (setup 90).
Why it printed:
- Trailing P/E 30.3 is below the semiconductors peer median 34.4 (12% cheaper).
- Market cap still sits above the peer median ($5.12T vs $829.2B).
- Cap is more than 2× the peer median — quality/size filter.
- VIX regime is low (16.68).
- Relative volume 1.12x.
Invalidation: Multiple re-rates up to the peer median P/E, or a daily close back below SMA200; stop ~199.72.
Continuation of the 2026-10-19 alert, not a new one — this is print 13 of one run: the same call has gone out 12 times since 2026-10-02 across 20 calendar days, most recently on 2026-10-19. Today is not a fresh signal; the setup was already true when the desk last printed it. The analog below measures the first session of a run, so its hit rate belongs to 2026-10-02, not to today.
Same-setup analogs on 21 names (n=266, n_eff=86.5, 95% CI 48–68%): 58% 21-session net hit rate against a 59% base rate, average +3.0%, vs SPY +1.3%.
The 95% interval includes 50%, so this is the desk's narrative setup rather than a demonstrated edge.
LLM confirm at 73/100: The observation accurately highlights a rare valuation discount relative to semiconductor peers for a market leader. Low volatility conditions provide a stable backdrop for accumulation despite short-term relative lag. The setup remains constructive as long as the primary trend holds.
Risk: Continued relative weakness against the S&P 500 could weigh on near-term price recovery.
KLA (KLAC)
Scanner what happened: KLAC sat in a deep drawdown during VIX stress at 72/100 (setup 90).
Why it printed:
- Close is -51.9% from the 52-week high — a deep drawdown.
- Drawdown reaches 35% from the high.
- Drawdown reaches 50% from the high.
- Drawdown is at least the mean of this name's largest completed pullbacks (37.9%).
- RSI_14=24.1 is washed out.
- TTM EPS is still growing through the drawdown (12.9% YoY).
Invalidation: Stop ~131.25 (2x ATR) or TTM earnings turning negative.
Continuation of the 2026-10-13 alert, not a new one — this is print 2 of one run: the same call went out on 2026-10-13. Today is not a fresh signal; the setup was already true when the desk last printed it. The analog below measures the first session of a run, so its hit rate belongs to 2026-10-13, not to today.
Same-setup analogs on 21 names (n=221, n_eff=58.2, 95% CI 50–74%): 63% 21-session net hit rate against a 59% base rate, average +3.6%, vs SPY +1.4%.
The 95% interval includes 50%, so this is the desk's narrative setup rather than a demonstrated edge.
LLM confirm at 72/100: This deep drawdown value setup is supported by robust fundamental earnings growth persisting through the cyclical pullback. An oversold RSI combined with elevated relative volume points toward potential exhaustion selling. Historic analog expectations favor a mean reversion bounce.
Risk: Deteriorating semiconductor equipment spending could invalidate the fundamental support underneath the drawdown.
Texas Instruments (TXN)
Scanner what happened: TXN pulled back to its 20-day average inside an uptrend at 71/100 (setup 90).
Why it printed:
- Price above SMA50 and SMA50 above SMA200 (bullish regime).
- VIX regime is low (16.68).
- RSI_14=50.4 is a reset, not a chase.
- Close is -1.4% from SMA20 (pullback/tag).
- 21d relative strength vs SPY is 3.0%.
- Relative volume 2.13x.
Invalidation: Stop ~261.27 (2x ATR) or daily close back below SMA50.
Continuation of the 2026-10-14 alert, not a new one — this is print 2 of one run: the same call went out on 2026-10-14. Today is not a fresh signal; the setup was already true when the desk last printed it. The analog below measures the first session of a run, so its hit rate belongs to 2026-10-14, not to today.
Same-setup analogs on 21 names (n=1022, n_eff=114.2, 95% CI 51–68%): 60% 21-session net hit rate against a 59% base rate, average +2.8%, vs SPY +1.5%.
The 95% interval includes 50%, so this is the desk's narrative setup rather than a demonstrated edge.
LLM confirm at 71/100: The pullback to the short-term moving average aligns well with a strong underlying trend and low VIX regime. Heavy relative volume on the tag indicates active sponsorship defending the trend. The setup offers a clean risk-reward profile for continuation.
Risk: A breakdown below the 50-day moving average would negate the bullish continuation setup.
Micron Technology (MU)
Scanner what happened: MU traded cheaper than its industry peers on trailing P/E at 72/100 (setup 90).
Why it printed:
- Trailing P/E 11.3 is below the semiconductors peer median 57.3 (80% cheaper).
- Market cap still sits above the peer median ($969.1B vs $640.5B).
- VIX regime is low (16.68).
- Relative volume 1.11x.
Invalidation: Multiple re-rates up to the peer median P/E, or a daily close back below SMA200; stop ~758.88.
Continuation of the 2026-10-15 alert, not a new one — this is print 11 of one run: the same call has gone out 10 times since 2026-10-02 across 20 calendar days, most recently on 2026-10-15. Today is not a fresh signal; the setup was already true when the desk last printed it. The analog below measures the first session of a run, so its hit rate belongs to 2026-10-02, not to today.
Same-setup analogs on 21 names (n=266, n_eff=86.5, 95% CI 48–68%): 58% 21-session net hit rate against a 59% base rate, average +3.0%, vs SPY +1.3%.
The 95% interval includes 50%, so this is the desk's narrative setup rather than a demonstrated edge.
LLM confirm at 72/100: The valuation gap compared to the semiconductor peer group is exceptionally wide and meets quality filters. Muted volatility allows the technical reset to unfold without excessive panic selling. Volume patterns suggest steady institutional interest.
Risk: High cyclicality in memory pricing can lead to sharp drawdowns if sector sentiment sours.
Applied Materials (AMAT)
Scanner what happened: AMAT traded cheaper than its industry peers on trailing P/E at 66/100 (setup 82).
Why it printed:
- Trailing P/E 34.4 is below the semiconductor equipment peer median 39.3 (12% cheaper).
- Market cap still sits above the peer median ($298.1B vs $288.0B).
- VIX regime is low (16.68).
- Relative volume 1.83x.
Invalidation: Multiple re-rates up to the peer median P/E, or a daily close back below SMA200; stop ~334.62.
Continuation of the 2026-10-12 alert, not a new one — this is print 6 of one run: the same call has gone out 5 times since 2026-10-06 across 16 calendar days, most recently on 2026-10-12. Today is not a fresh signal; the setup was already true when the desk last printed it. The analog below measures the first session of a run, so its hit rate belongs to 2026-10-06, not to today.
Same-setup analogs on 21 names (n=266, n_eff=86.5, 95% CI 48–68%): 58% 21-session net hit rate against a 59% base rate, average +3.0%, vs SPY +1.3%.
The 95% interval includes 50%, so this is the desk's narrative setup rather than a demonstrated edge.
LLM haircut at 65/100: While the P/E discount is modest and volume is elevated, the persistent negative relative strength dampens immediate upside potential. The setup is acceptable but lacks the strength of top-tier peers in the same industry. Caution is warranted given the weak momentum profile.
Risk: Persistent relative underperformance could turn this value setup into a protracted value trap.
Analog Devices (ADI)
Scanner what happened: ADI pulled back to its 20-day average inside an uptrend at 60/100 (setup 75).
Why it printed:
- Price above SMA50 and SMA50 above SMA200 (bullish regime).
- VIX regime is low (16.68).
- RSI_14=43.8 is a reset, not a chase.
- 21d relative strength vs SPY is 0.6%.
- Relative volume 1.97x.
Invalidation: Stop ~359.46 (2x ATR) or daily close back below SMA50.
Same-setup analogs on 21 names (n=1022, n_eff=114.2, 95% CI 51–68%): 60% 21-session net hit rate against a 59% base rate, average +2.8%, vs SPY +1.5%.
The 95% interval includes 50%, so this is the desk's narrative setup rather than a demonstrated edge.
LLM wait at 60/100: The pullback parameters are technically sound within an established uptrend, but the lack of distinctive edge makes it a lower-priority watch. Volume is supportive, yet the risk-reward profile does not demand immediate action. It is best kept on a secondary monitoring list.
Risk: Choppy sideways consolidation could tie up capital without delivering expected trend continuation.
Lam Research (LRCX)
Scanner what happened: LRCX sat in a deep drawdown during VIX stress at 55/100 (setup 68).
Why it printed:
- Close is -47.5% from the 52-week high — a deep drawdown.
- Drawdown reaches 35% from the high.
- RSI_14=24.6 is washed out.
- Trailing P/E is 13% cheaper than the industry-peer median.
- TTM EPS is still growing through the drawdown (48.9% YoY).
Invalidation: Stop ~199.14 (2x ATR) or TTM earnings turning negative.
Same-setup analogs on 21 names (n=221, n_eff=58.2, 95% CI 50–74%): 63% 21-session net hit rate against a 59% base rate, average +3.6%, vs SPY +1.4%.
The 95% interval includes 50%, so this is the desk's narrative setup rather than a demonstrated edge.
LLM haircut at 55/100: The deep drawdown is backed by strong earnings growth, but severe relative weakness against the market makes catching this falling knife precarious. High relative volume shows heavy liquidation is still working through the order books. A confirmed stabilization phase is preferred over early entry.
Risk: Deeper technical damage could extend the drawdown well beyond historical mean reversion expectations.
Apple Inc. (AAPL)
Scanner what happened: AAPL closed near a 52-week high at 52/100 (setup 65).
Why it printed:
- Within 0.0% of 52-week high.
- Still in a bullish SMA regime.
- Beating SPY by 3.8% over 21d.
- VIX regime low.
Invalidation: Failed breakout if close back below prior 52w high and stop ~335.33.
Same-setup analogs on 21 names (n=739, n_eff=101.1, 95% CI 49–67%): 58% 21-session net hit rate against a 59% base rate, average +2.8%, vs SPY +1.7%.
The 95% interval includes 50%, so this is the desk's narrative setup rather than a demonstrated edge.
LLM wait at 52/100: Trading directly at 52-week highs with an elevated RSI increases vulnerability to short-term exhaustion or breakout failure. Although relative strength is positive, initiating new long exposure at absolute peaks offers a poor risk-reward ratio. Waiting for a minor consolidation is the prudent course.
Risk: A failed breakout pattern could quickly retrace gains back toward the core moving averages.
Overall: mixed hybrid tape. Read each card's scanner grade, LLM stance, and hybrid conviction separately — not as one market call.
RESEARCH ONLY — not advice.
Scanner names what happened on the tape. The model grades that observation. Hybrid conviction is what publishes. The model cannot add a name that did not fire. Research only — not a timing call.
add reminders
Five add reminders
Live add reminders: K1 Weekly RSI (fear), K2 Weekly RSI (elevated), K3 Daily RSI (fear), K4 Daily RSI (elevated), and K5 Daily RSI (calm). Exclusive listing, strongest first. K6 Weekly RSI (industry stress), K7 Weekly RSI (industry elevated), K8 Daily RSI (industry stress), K9 Daily RSI (industry elevated), and K10 Daily RSI (industry calm) repeat those shapes on the name's industry tape and can print on the same close. K11 Weekly RSI and K12 Daily RSI are that name's own RSI and can print on the same close. Not a named setup. Does not score. Now vs 52w is close versus the 252-session high. This-name median is that same drawdown on this ticker's prior fires of the same gate.
Target is this close times that row's frozen average move. Strike is 5% under the target. 21 / 30 / 60 / 90 / 180 are trading sessions. Not a listed contract and not a premium.
K5 Daily RSI (calm)
KLAC 147.83
- RSI
- 24.1
- VIX
- 16.68
- Now vs 52w
- -51.9%
- This name median
- -22.8% n=6
- Prior fires
- 6 on this name
- ATM put proxy
- +1.9%
Target / strike
- 21d +4.6% → 154.66 · strike 146.93
- 30d +5.8% → 156.35 · strike 148.53
- 60d +9.2% → 161.38 · strike 153.31
- 90d +12.0% → 165.64 · strike 157.36
- 180d +30.8% → 193.34 · strike 183.68
this name n=6 · 7d +1.4% (80% ITM) · 14d +3.9% (80% ITM) · 21d +4.4% (100% ITM) · 28d +8.4% (100% ITM)
- 2017-08-04 · 7d +2.5% · 14d +1.7% · 21d +5.4% · 28d +9.7%
- 2018-06-27 · 7d +5.3% · 14d +9.5% · 21d +6.9% · 28d +17.4%
- 2018-10-19 · 7d +0.9% · 14d +6.9% · 21d +1.7% · 28d +6.5%
- 2019-05-14 · 7d -4.6% · 14d -3.9% · 21d +1.3% · 28d +3.3%
- 2024-11-15 · 7d +2.8% · 14d +5.5% · 21d +6.6% · 28d +4.9%
- 2026-10-20 · 7d — · 14d — · 21d — · 28d —
AMAT 375.58
- RSI
- 25.4
- VIX
- 16.68
- Now vs 52w
- -49.2%
- This name median
- -31.1% n=5
- Prior fires
- 5 on this name
- ATM put proxy
- +1.9%
Target / strike
- 21d +4.6% → 392.94 · strike 373.30
- 30d +5.8% → 397.22 · strike 377.36
- 60d +9.2% → 410.01 · strike 389.51
- 90d +12.0% → 420.83 · strike 399.79
- 180d +30.8% → 491.21 · strike 466.65
this name n=5 · 7d +0.7% (75% ITM) · 14d -4.2% (50% ITM) · 21d -2.8% (50% ITM) · 28d +3.7% (50% ITM)
- 2018-06-27 · 7d +2.8% · 14d +6.7% · 21d +6.7% · 28d +9.7%
- 2018-08-22 · 7d +0.1% · 14d -10.7% · 21d -7.8% · 28d -9.5%
- 2018-09-25 · 7d -1.8% · 14d -13.3% · 21d -17.5% · 28d -8.6%
- 2025-08-15 · 7d +1.7% · 14d +0.6% · 21d +7.3% · 28d +23.4%
- 2026-10-16 · 7d — · 14d — · 21d — · 28d —
LRCX 230.15
- RSI
- 24.6
- VIX
- 16.68
- Now vs 52w
- -47.5%
- This name median
- -25.8% n=5
- Prior fires
- 5 on this name
- ATM put proxy
- +1.9%
Target / strike
- 21d +4.6% → 240.79 · strike 228.75
- 30d +5.8% → 243.41 · strike 231.24
- 60d +9.2% → 251.25 · strike 238.69
- 90d +12.0% → 257.88 · strike 244.98
- 180d +30.8% → 301.01 · strike 285.96
this name n=5 · 7d -0.4% (60% ITM) · 14d -0.1% (60% ITM) · 21d +3.2% (80% ITM) · 28d +3.3% (80% ITM)
- 2017-12-04 · 7d +0.3% · 14d +3.3% · 21d +7.0% · 28d +5.3%
- 2018-06-18 · 7d -2.5% · 14d +1.6% · 21d +4.1% · 28d +9.1%
- 2018-09-06 · 7d -5.0% · 14d -7.0% · 21d -7.6% · 28d -9.2%
- 2018-10-08 · 7d +0.8% · 14d -4.8% · 21d +4.1% · 28d +0.2%
- 2019-06-03 · 7d +4.3% · 14d +6.1% · 21d +8.6% · 28d +10.9%
K9 Daily RSI (industry elevated)
KLAC 147.83 SMH 32.8
- RSI
- 24.1
- VIX
- 16.68
- Now vs 52w
- -51.9%
- This name median
- —
- Prior fires
- —
- ATM put proxy
- +1.9%
AMAT 375.58 SMH 32.8
- RSI
- 25.4
- VIX
- 16.68
- Now vs 52w
- -49.2%
- This name median
- —
- Prior fires
- —
- ATM put proxy
- +1.9%
LRCX 230.15 SMH 32.8
- RSI
- 24.6
- VIX
- 16.68
- Now vs 52w
- -47.5%
- This name median
- —
- Prior fires
- —
- ATM put proxy
- +1.9%
K12 Daily RSI
KLAC 147.83
- RSI
- 24.1
- VIX
- 16.68
- Now vs 52w
- -51.9%
- This name median
- -27.9% n=10
- Prior fires
- 10 on this name
- ATM put proxy
- +1.9%
Target / strike
- 21d +4.6% → 154.66 · strike 146.93
- 30d +5.8% → 156.46 · strike 148.64
- 60d +12.0% → 165.56 · strike 157.28
- 90d +17.6% → 173.86 · strike 165.17
- 180d +34.3% → 198.47 · strike 188.55
this name n=10 · 7d +5.5% (78% ITM) · 14d +5.0% (67% ITM) · 21d +10.2% (100% ITM) · 28d +14.4% (89% ITM)
- 2017-08-04 · 7d +2.5% · 14d +1.7% · 21d +5.4% · 28d +9.7%
- 2018-06-27 · 7d +5.3% · 14d +9.5% · 21d +6.9% · 28d +17.4%
- 2018-10-10 · 7d -3.2% · 14d -2.4% · 21d +3.4% · 28d -1.6%
- 2018-12-24 · 7d +12.4% · 14d +13.9% · 21d +24.8% · 28d +31.5%
- 2019-05-13 · 7d -2.7% · 14d -6.5% · 21d +1.2% · 28d +4.7%
- 2020-09-11 · 7d +6.6% · 14d +15.7% · 21d +24.8% · 28d +20.0%
- 2022-09-26 · 7d +8.4% · 14d -13.1% · 21d +0.4% · 28d +3.6%
- 2024-11-15 · 7d +2.8% · 14d +5.5% · 21d +6.6% · 28d +4.9%
- 2025-04-04 · 7d +17.3% · 14d +20.5% · 21d +17.8% · 28d +39.8%
- 2026-10-20 · 7d — · 14d — · 21d — · 28d —
AMAT 375.58
- RSI
- 25.4
- VIX
- 16.68
- Now vs 52w
- -49.2%
- This name median
- -33.2% n=10
- Prior fires
- 10 on this name
- ATM put proxy
- +1.9%
Target / strike
- 21d +4.6% → 392.94 · strike 373.29
- 30d +5.8% → 397.50 · strike 377.63
- 60d +12.0% → 420.61 · strike 399.58
- 90d +17.6% → 441.71 · strike 419.63
- 180d +34.3% → 504.25 · strike 479.03
this name n=10 · 7d +1.8% (78% ITM) · 14d -0.9% (44% ITM) · 21d +4.8% (78% ITM) · 28d +9.4% (78% ITM)
- 2018-02-05 · 7d +7.6% · 14d +21.7% · 21d +23.0% · 28d +23.0%
- 2018-06-27 · 7d +2.8% · 14d +6.7% · 21d +6.7% · 28d +9.7%
- 2018-08-22 · 7d +0.1% · 14d -10.7% · 21d -7.8% · 28d -9.5%
- 2018-09-25 · 7d -1.8% · 14d -13.3% · 21d -17.5% · 28d -8.6%
- 2019-05-13 · 7d +3.6% · 14d -0.8% · 21d +6.2% · 28d +9.9%
- 2020-03-12 · 7d -11.0% · 14d -4.0% · 21d +10.6% · 28d +15.5%
- 2022-06-16 · 7d +6.1% · 14d +1.8% · 21d +9.6% · 28d +17.4%
- 2022-09-26 · 7d +7.6% · 14d -9.8% · 21d +5.5% · 28d +4.1%
- 2025-08-15 · 7d +1.7% · 14d +0.6% · 21d +7.3% · 28d +23.4%
- 2026-10-16 · 7d — · 14d — · 21d — · 28d —
LRCX 230.15
- RSI
- 24.6
- VIX
- 16.68
- Now vs 52w
- -47.5%
- This name median
- -32.2% n=10
- Prior fires
- 10 on this name
- ATM put proxy
- +1.9%
Target / strike
- 21d +4.6% → 240.79 · strike 228.75
- 30d +5.8% → 243.58 · strike 231.40
- 60d +12.0% → 257.75 · strike 244.86
- 90d +17.6% → 270.68 · strike 257.14
- 180d +34.3% → 309.00 · strike 293.55
this name n=10 · 7d +3.3% (80% ITM) · 14d +3.0% (70% ITM) · 21d +8.5% (80% ITM) · 28d +11.7% (80% ITM)
- 2017-12-04 · 7d +0.3% · 14d +3.3% · 21d +7.0% · 28d +5.3%
- 2018-06-18 · 7d -2.5% · 14d +1.6% · 21d +4.1% · 28d +9.1%
- 2018-09-06 · 7d -5.0% · 14d -7.0% · 21d -7.6% · 28d -9.2%
- 2018-10-08 · 7d +0.8% · 14d -4.8% · 21d +4.1% · 28d +0.2%
- 2018-12-24 · 7d +12.0% · 14d +13.6% · 21d +34.2% · 28d +40.9%
- 2019-06-03 · 7d +4.3% · 14d +6.1% · 21d +8.6% · 28d +10.9%
- 2020-09-11 · 7d +8.4% · 14d +15.4% · 21d +25.9% · 28d +24.7%
- 2022-09-22 · 7d +0.7% · 14d -16.2% · 21d -4.5% · 28d +6.7%
- 2024-08-02 · 7d +10.2% · 14d +9.5% · 21d +0.4% · 28d -2.0%
- 2025-04-03 · 7d +4.0% · 14d +8.7% · 21d +13.3% · 28d +30.3%
Quiet today: K1 Weekly RSI (fear) · K2 Weekly RSI (elevated) · K3 Daily RSI (fear) · K4 Daily RSI (elevated) · K6 Weekly RSI (industry stress) · K7 Weekly RSI (industry elevated) · K8 Daily RSI (industry stress) · K10 Daily RSI (industry calm) · K11 Weekly RSI.
Quiet watch: no desk name is approaching. VIX must already be 30.
AMZN AMZN traded cheaper than its industry peers on trailing P/E
Hybrid 87/100 · buy · named setup cheap vs industry
Scanner 88/100 LLM confirm 85/100
The setup identifies a valid valuation discount relative to peer medians while operating in a low VIX regime. Relative strength and volume metrics confirm institutional accumulation behind the move. The defined invalidation level provides a clean structural boundary for risk control.
Multiple re-rates up to the peer median P/E, or a daily close back below SMA200; stop ~236.63.
- Close
- 250.38
- vs SMA20
- -1.6%
- RSI 14
- 45.1
- Stop
- 236.63
Pattern readings
| Pattern | Current | Threshold | vs | Status |
|---|---|---|---|---|
| Historic drawdown | 11.8% | >= top-3 avg 40.4% | 0.29x | below |
| 20d range high | 250.38 | > 265.34 | -5.6% | below |
| 20d range low | 250.38 | < 244.73 | +2.3% | below |
| Relative volume | 1.33x | >= 1.50x expansion / <= 0.70x dry-up | 0.88x vs expansion | below |
| RSI_14 | 45.1 | oversold < 30 · reset 35-58 · overbought > 70 | mid 30-70 | inside |
| MACD vs signal | 0.941 vs 0.722 | cross up: line > signal after line <= signal | spread 0.218 | above |
| Bollinger squeeze | width 8.659 | <= 20%ile cutoff 7.275 | 1.19x cutoff | below |
| vs SMA20 (pullback tag) | -1.6% | -4.0% to +1.2% | -1.6% | met |
| vs 52w high (breakout) | -12.8% | >= -3.0% (within 3% of high) | -12.8% | below |
| SMA50 vs SMA200 | 255.99 vs 243.26 | golden: 50 > 200 · death: 50 < 200 | +5.2% | above |
| VIX | 16.68 (low) | elevated >= 20 · stress >= 30 | 16.68 | low |
Similar-setup analog
cheap vs industry onset · 266 samples · last 2300 sessions (publish window). What happened on similar days — not a forecast.
| Horizon | n | Hit rate | Base rate | Avg | vs SPY | Beat SPY |
|---|---|---|---|---|---|---|
| 5d | 265 | 57% | 54% | +0.9% | +0.5% | 56% |
| 10d | 265 | 59% | 56% | +1.9% | +0.8% | 52% |
| 21d | 263 | 58% | 59% | +3.0% | +1.3% | 52% |
| 63d | 260 | 65% | 63% | +9.6% | +5.6% | 58% |
| 126d | 251 | 68% | 68% | +17.6% | +10.3% | 59% |
Hit rate is shown next to the 21-session base rate so the comparison is unavoidable. The ~60% absolute up-rate is not an expected future return: the universe is today's winners chosen after the fact. Beat SPY is how often one trade finished ahead of the index; the SPY columns carry no trading cost because buying the index pays the same round trip.
Print board
Discussion
0 notes on this close. Research talk, not advice.
Sign in to join the thread. Reading is open.
No notes yet. First take on this tape is open.