
Close print
2026-10-14
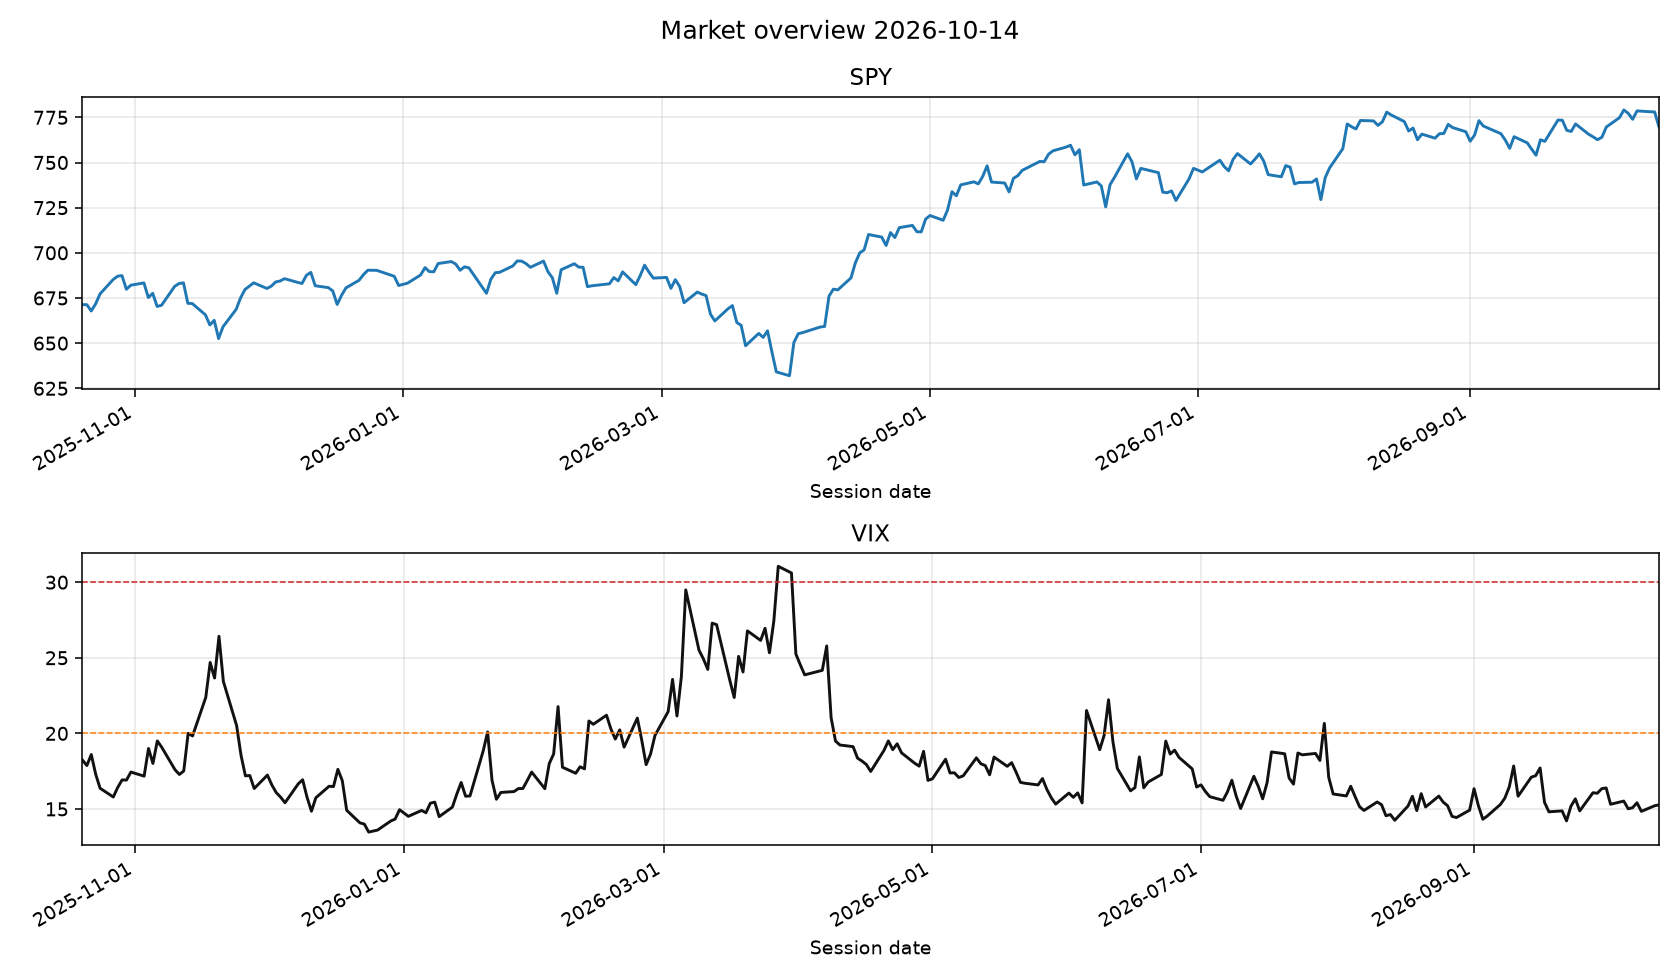
- VIX 15.27 low
- SPY 769.67
- 5 named setups
- Free teaser
Over the measured window — ten years of the local tape, 21 names, onsets spaced so one market phase counts once, and a 10 bps round trip — no named setup beat holding these companies. The unconditional 21-session up-rate was 58.67%. On buy-now versus wait through the next 21 sessions, every setup landed between −0.67% and +0.64% against a random session. One setup clears the publish gate: historic_drawdown at a 61.25% net hit rate on 352 onsets, and its 95% interval bottoms out at 50.33% — a third of a point above a coin. Read that as a gate it passed, not an edge it demonstrated. The desk publishes named setups as context — what happened on the tape — not as timing calls. Scheduled accumulation is the default the evidence supports. The 58.67% figure is not an expected future return: the universe is today's survivors chosen after the fact, which inflates the absolute up-rate.
selloff read
Broad drop or a sector split
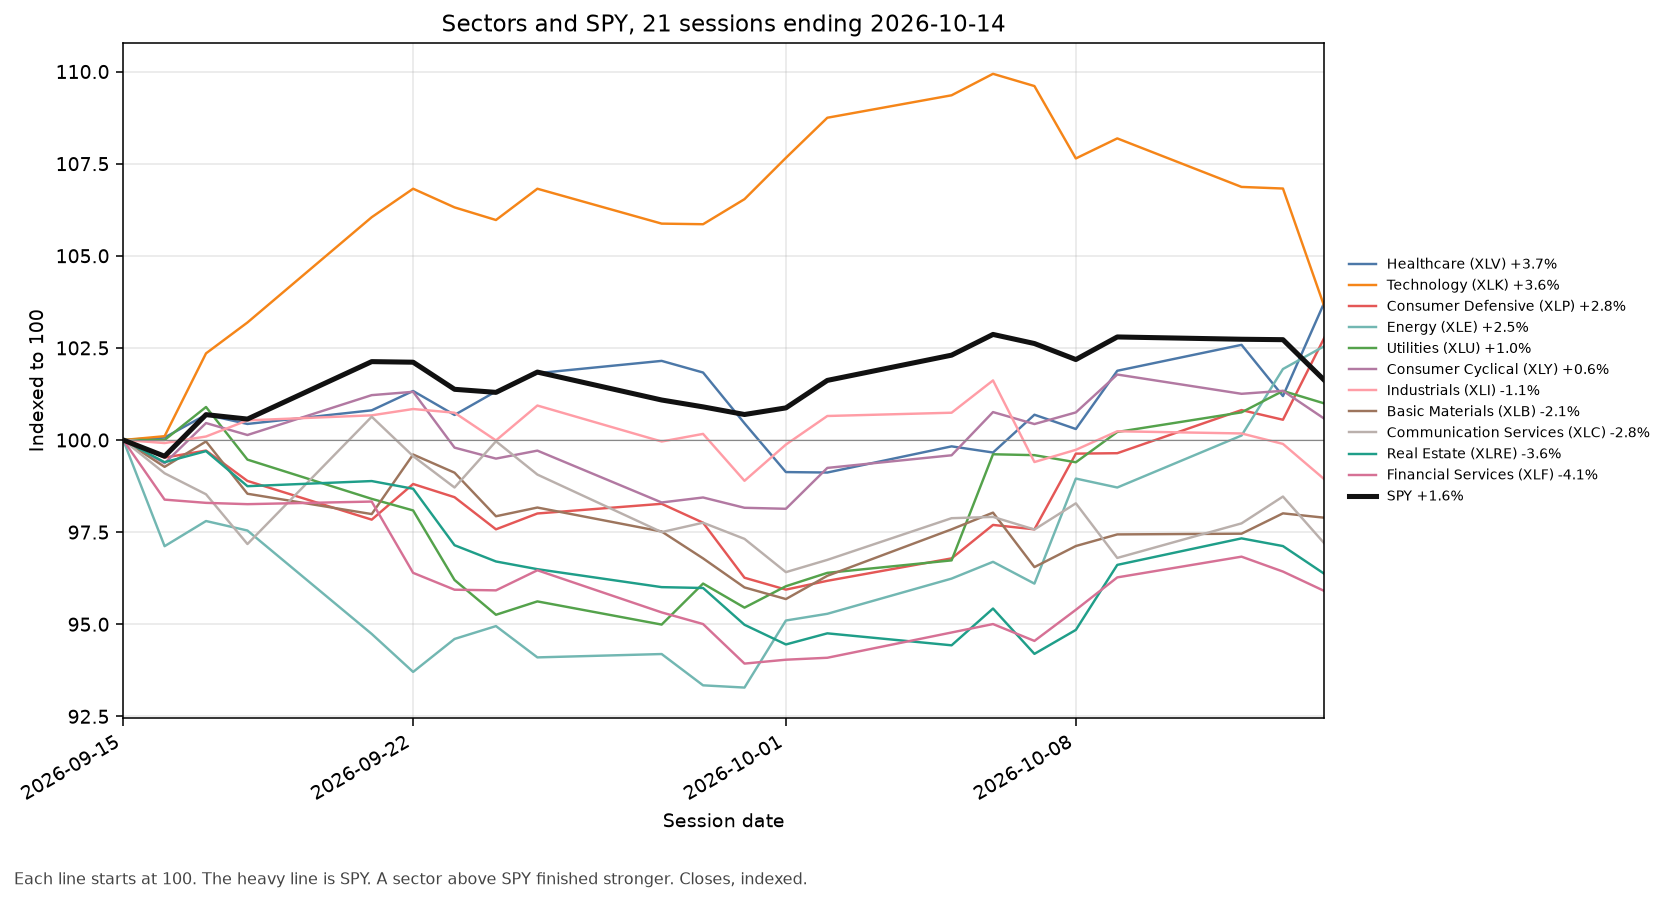
SPY closed -1.1% on the session. Reads whether stored names fell together or sectors split. Each window lists every sector ETF from strongest to weakest. The chart draws SPY and each sector ETF over the last 21 sessions, each indexed to 100 at the start. Not a buy or a sell. Not a named setup. Today's name panel is short of the recent tape, so this read is incomplete.
1 session · sector
SPY -1.1%. Median name -3.1%. names down 95% (21). sectors down 8/11.
Best XLV +2.5%. Worst XLK -3.0%.
- Healthcare XLV +2.5%
- Consumer Defensive XLP +2.2%
- Energy XLE +0.6%
- Basic Materials XLB -0.1%
- Utilities XLU -0.3%
- Financial Services XLF -0.5%
- Consumer Cyclical XLY -0.7%
- Real Estate XLRE -0.8%
- Industrials XLI -1.0%
- Communication Services XLC -1.3%
- Technology XLK -3.0%
5 sessions · sector
SPY -1.0%. Median name -6.8%. names down 86% (21). sectors down 3/11.
Best XLE +6.7%. Worst XLK -5.5%.
- Energy XLE +6.7%
- Consumer Defensive XLP +5.3%
- Healthcare XLV +3.0%
- Real Estate XLRE +2.3%
- Financial Services XLF +1.4%
- Utilities XLU +1.4%
- Basic Materials XLB +1.4%
- Consumer Cyclical XLY +0.1%
- Communication Services XLC -0.4%
- Industrials XLI -0.5%
- Technology XLK -5.5%
21 sessions · rotation
SPY +1.6%. Median name +3.9%. names down 14% (21). sectors down 5/11.
Best XLV +3.7%. Worst XLF -4.1%.
- Healthcare XLV +3.7%
- Technology XLK +3.6%
- Consumer Defensive XLP +2.8%
- Energy XLE +2.5%
- Utilities XLU +1.0%
- Consumer Cyclical XLY +0.6%
- Industrials XLI -1.1%
- Basic Materials XLB -2.1%
- Communication Services XLC -2.8%
- Real Estate XLRE -3.6%
- Financial Services XLF -4.1%
Desk take
What we think of this print
Close print for 2026-10-14. VIX 15.27 (low) and SPY 769.67 set the tape. Hybrid desk: the scanner names the setup, the model grades that same print, and published conviction is the blend. The model cannot add a name that did not fire.
Amazon.com, Inc. (AMZN)
Scanner what happened: AMZN traded cheaper than its industry peers on trailing P/E at 83/100 (setup 100).
Why it printed:
- Trailing P/E 20.4 is below the internet retail / big-box peer median 28.6 (29% cheaper).
- Market cap still sits above the peer median ($2.74T vs $350.4B).
- Cap is more than 2× the peer median — quality/size filter.
- VIX regime is low (15.27).
- 21d relative strength vs SPY is 0.7%.
- Relative volume 0.89x.
Invalidation: Multiple re-rates up to the peer median P/E, or a daily close back below SMA200; stop ~242.50.
Same-setup analogs on 21 names (n=266, n_eff=84.9, 95% CI 48–68%): 58% 21-session net hit rate against a 59% base rate, average +3.1%, vs SPY +1.3%.
The 95% interval includes 50%, so this is the desk's narrative setup rather than a demonstrated edge.
LLM confirm at 83/100: Amazon trades at a meaningful 29% discount on trailing P/E relative to internet and big-box retail peers while maintaining a massive market cap premium. A low VIX regime provides an accommodative backdrop for large-cap valuation mean reversion. The setup accurately captures a quality-backed value entry with a reasonable relative volume profile.
Risk: Failing to hold the SMA200 or an unexpected sector-wide retail multiple compression could invalidate the trade.
NVIDIA Corporation (NVDA)
Scanner what happened: NVDA traded cheaper than its industry peers on trailing P/E at 93/100 (setup 100).
Why it printed:
- Trailing P/E 31.6 is below the semiconductors peer median 40.9 (23% cheaper).
- Market cap still sits above the peer median ($5.34T vs $931.8B).
- Cap is more than 2× the peer median — quality/size filter.
- VIX regime is low (15.27).
- 21d relative strength vs SPY is 2.7%.
- Relative volume 1.05x.
Invalidation: Multiple re-rates up to the peer median P/E, or a daily close back below SMA200; stop ~209.64.
Continuation of the 2026-10-13 alert, not a new one — this is print 9 of one run: the same call has gone out 8 times since 2026-10-02 across 12 calendar days, most recently on 2026-10-13. Today is not a fresh signal; the setup was already true when the desk last printed it. The analog below measures the first session of a run, so its hit rate belongs to 2026-10-02, not to today.
Same-setup analogs on 21 names (n=266, n_eff=84.9, 95% CI 48–68%): 58% 21-session net hit rate against a 59% base rate, average +3.1%, vs SPY +1.3%.
The 95% interval includes 50%, so this is the desk's narrative setup rather than a demonstrated edge.
LLM confirm at 93/100: Nvidia presents a compelling cheap_vs_industry print, trading 23% below its semiconductor peer median P/E despite dominant scale. Positive 21-day relative strength against the S&P 500 confirms institutional sponsorship is intact during this consolidation phase. Repeated appearances across recent sessions highlight persistent accumulation.
Risk: A breakdown below the 200-day moving average or sharp multiple contraction in high-beta semis poses immediate downside risk.
Taiwan Semiconductor (TSM)
Scanner what happened: TSM traded cheaper than its industry peers on trailing P/E at 93/100 (setup 100).
Why it printed:
- Trailing P/E 31.0 is below the semiconductors peer median 48.7 (36% cheaper).
- Market cap still sits above the peer median ($2.23T vs $931.8B).
- Cap is more than 2× the peer median — quality/size filter.
- VIX regime is low (15.27).
- 21d relative strength vs SPY is 2.3%.
- Relative volume 1.32x.
Invalidation: Multiple re-rates up to the peer median P/E, or a daily close back below SMA200; stop ~407.08.
Continuation of the 2026-10-13 alert, not a new one — this is print 6 of one run: the same call has gone out 5 times since 2026-10-07 across 7 calendar days, most recently on 2026-10-13. Today is not a fresh signal; the setup was already true when the desk last printed it. The analog below measures the first session of a run, so its hit rate belongs to 2026-10-07, not to today.
Same-setup analogs on 21 names (n=266, n_eff=84.9, 95% CI 48–68%): 58% 21-session net hit rate against a 59% base rate, average +3.1%, vs SPY +1.3%.
The 95% interval includes 50%, so this is the desk's narrative setup rather than a demonstrated edge.
LLM confirm at 93/100: Taiwan Semiconductor offers a stark valuation discount at a 36% lower trailing P/E than the semiconductor peer group. Strong relative volume and positive intermediate relative strength underscore active sponsorship. The multi-session repeat profile reinforces the validity of this accumulation setup.
Risk: Geopolitical overhangs or a loss of the key structural moving averages would quickly invalidate the thesis.
Texas Instruments (TXN)
Scanner what happened: TXN pulled back to its 20-day average inside an uptrend at 86/100 (setup 90).
Why it printed:
- Price above SMA50 and SMA50 above SMA200 (bullish regime).
- VIX regime is low (15.27).
- RSI_14=51.4 is a reset, not a chase.
- Close is 0.1% from SMA20 (pullback/tag).
- 21d relative strength vs SPY is 4.9%.
- Relative volume 1.12x.
Invalidation: Stop ~263.95 (2x ATR) or daily close back below SMA50.
Same-setup analogs on 21 names (n=1020, n_eff=113.5, 95% CI 51–68%): 60% 21-session net hit rate against a 59% base rate, average +2.8%, vs SPY +1.5%.
The 95% interval includes 50%, so this is the desk's narrative setup rather than a demonstrated edge.
LLM confirm at 86/100: Texas Instruments executes a clean pullback in a firmly established bullish trend above both the 50-day and 200-day moving averages. An RSI reset near 51 combined with a tag of the 20-day moving average offers an optimal risk-reward entry. Robust relative strength confirms underlying demand.
Risk: A failure to hold the 50-day moving average or a broader market correction would violate the structural uptrend.
Micron Technology (MU)
Scanner what happened: MU traded cheaper than its industry peers on trailing P/E at 86/100 (setup 90).
Why it printed:
- Trailing P/E 12.1 is below the semiconductors peer median 66.4 (82% cheaper).
- Market cap still sits above the peer median ($1.03T vs $725.3B).
- VIX regime is low (15.27).
- Relative volume 0.99x.
Invalidation: Multiple re-rates up to the peer median P/E, or a daily close back below SMA200; stop ~820.69.
Continuation of the 2026-10-13 alert, not a new one — this is print 9 of one run: the same call has gone out 8 times since 2026-10-02 across 12 calendar days, most recently on 2026-10-13. Today is not a fresh signal; the setup was already true when the desk last printed it. The analog below measures the first session of a run, so its hit rate belongs to 2026-10-02, not to today.
Same-setup analogs on 21 names (n=266, n_eff=84.9, 95% CI 48–68%): 58% 21-session net hit rate against a 59% base rate, average +3.1%, vs SPY +1.3%.
The 95% interval includes 50%, so this is the desk's narrative setup rather than a demonstrated edge.
LLM haircut at 75/100: Micron screens extremely cheap on a trailing P/E basis compared to industry peers, reflecting cyclical sector dynamics. However, negative 21-day relative strength against the broader market tempers immediate upside enthusiasm. While the valuation thesis holds, lack of near-term relative momentum warrants a slight haircut.
Risk: Persistent underperformance versus SPY and cyclical demand shocks present ongoing volatility threats.
Alphabet Inc. (GOOGL)
Scanner what happened: GOOGL traded cheaper than its industry peers on trailing P/E at 71/100 (setup 82).
Why it printed:
- Trailing P/E 17.5 is below the interactive media peer median 18.2 (4% cheaper).
- Market cap still sits above the peer median ($2.04T vs $9.9B).
- Cap is more than 2× the peer median — quality/size filter.
- VIX regime is low (15.27).
- Relative volume 1.00x.
Invalidation: Multiple re-rates up to the peer median P/E, or a daily close back below SMA200; stop ~330.68.
Same-setup analogs on 21 names (n=266, n_eff=84.9, 95% CI 48–68%): 58% 21-session net hit rate against a 59% base rate, average +3.1%, vs SPY +1.3%.
The 95% interval includes 50%, so this is the desk's narrative setup rather than a demonstrated edge.
LLM confirm at 71/100: Alphabet qualifies as a modest value opportunity with a trailing P/E slightly below the interactive media peer group. The large market capitalization filter ensures quality and stability in a low VIX environment. RSI sitting right near the midpoint suggests a balanced, non-extended entry point.
Risk: A daily close below the 200-day moving average would invalidate the structural support thesis.
KLA (KLAC)
Scanner what happened: KLAC sat in a deep drawdown during VIX stress at 77/100 (setup 78).
Why it printed:
- Close is -41.8% from the 52-week high — a deep drawdown.
- Drawdown reaches 35% from the high.
- Drawdown is at least the mean of this name's largest completed pullbacks (37.9%).
- Trailing P/E is 2% cheaper than the industry-peer median.
- TTM EPS is still growing through the drawdown (12.9% YoY).
Invalidation: Stop ~163.05 (2x ATR) or TTM earnings turning negative.
Continuation of the 2026-10-13 alert, not a new one — this is print 2 of one run: the same call went out on 2026-10-13. Today is not a fresh signal; the setup was already true when the desk last printed it. The analog below measures the first session of a run, so its hit rate belongs to 2026-10-13, not to today.
Same-setup analogs on 21 names (n=221, n_eff=58.2, 95% CI 50–74%): 63% 21-session net hit rate against a 59% base rate, average +3.6%, vs SPY +1.4%.
The 95% interval includes 50%, so this is the desk's narrative setup rather than a demonstrated edge.
LLM confirm at 77/100: KLA displays a classic deep drawdown value setup, sitting over 41% off its 52-week high while continuing to grow earnings year-over-year. Positive 21-day relative strength and elevated relative volume suggest buyers are stepping in to absorb supply at these depressed levels. This washout buy is well-supported by fundamental earnings resilience.
Risk: A sudden contraction in TTM earnings or a breach of the 2x ATR stop level would invalidate the reversal.
Advanced Micro Devices (AMD)
Scanner what happened: AMD pulled back to its 20-day average inside an uptrend at 74/100 (setup 75).
Why it printed:
- Price above SMA50 and SMA50 above SMA200 (bullish regime).
- VIX regime is low (15.27).
- RSI_14=46.5 is a reset, not a chase.
- 21d relative strength vs SPY is 11.6%.
- Relative volume 0.98x.
Invalidation: Stop ~519.70 (2x ATR) or daily close back below SMA50.
Continuation of the 2026-10-13 alert, not a new one — this is print 2 of one run: the same call went out on 2026-10-13. Today is not a fresh signal; the setup was already true when the desk last printed it. The analog below measures the first session of a run, so its hit rate belongs to 2026-10-13, not to today.
Same-setup analogs on 21 names (n=1020, n_eff=113.5, 95% CI 51–68%): 60% 21-session net hit rate against a 59% base rate, average +2.8%, vs SPY +1.5%.
The 95% interval includes 50%, so this is the desk's narrative setup rather than a demonstrated edge.
LLM confirm at 74/100: Advanced Micro Devices demonstrates strong trend health with double-digit relative strength over the past 21 days. The RSI reading near 46 provides a constructive pullback reset rather than a dangerous chase. Moving average alignment confirms the broader bullish regime.
Risk: A sharp reversal below the 50-day moving average would signal momentum failure.
Analog Devices (ADI)
Scanner what happened: ADI pulled back to its 20-day average inside an uptrend at 74/100 (setup 75).
Why it printed:
- Price above SMA50 and SMA50 above SMA200 (bullish regime).
- VIX regime is low (15.27).
- RSI_14=55.8 is a reset, not a chase.
- 21d relative strength vs SPY is 10.1%.
- Relative volume 1.49x.
Invalidation: Stop ~380.71 (2x ATR) or daily close back below SMA50.
Same-setup analogs on 21 names (n=1020, n_eff=113.5, 95% CI 51–68%): 60% 21-session net hit rate against a 59% base rate, average +2.8%, vs SPY +1.5%.
The 95% interval includes 50%, so this is the desk's narrative setup rather than a demonstrated edge.
LLM confirm at 74/100: Analog Devices maintains robust outperformance with notable 21-day relative strength against the S&P 500. High relative volume on the session signals institutional accumulation during this constructive pullback. The moving average stack remains cleanly bullish.
Risk: Failing to hold immediate support near the 50-day moving average invalidates the continuation pattern.
Marvell Technology (MRVL)
Scanner what happened: MRVL pulled back to its 20-day average inside an uptrend at 74/100 (setup 75).
Why it printed:
- Price above SMA50 and SMA50 above SMA200 (bullish regime).
- VIX regime is low (15.27).
- RSI_14=44.5 is a reset, not a chase.
- 21d relative strength vs SPY is 9.0%.
- Relative volume 1.20x.
Invalidation: Stop ~213.67 (2x ATR) or daily close back below SMA50.
Same-setup analogs on 21 names (n=1020, n_eff=113.5, 95% CI 51–68%): 60% 21-session net hit rate against a 59% base rate, average +2.8%, vs SPY +1.5%.
The 95% interval includes 50%, so this is the desk's narrative setup rather than a demonstrated edge.
LLM confirm at 74/100: Marvell Technology benefits from a healthy bullish regime supported by strong intermediate relative strength. A mid-40s RSI reading offers an ideal consolidation entry within an ongoing uptrend. Elevated relative volume points to active sponsorship.
Risk: A breakdown below the defined ATR stop level would negate the bullish continuation setup.
Meta Platforms, Inc. (META)
Scanner what happened: META pulled back to its 20-day average inside an uptrend at 62/100 (setup 70).
Why it printed:
- Price above SMA50 and SMA50 above SMA200 (bullish regime).
- VIX regime is low (15.27).
- Close is 0.9% from SMA20 (pullback/tag).
- 21d relative strength vs SPY is 8.4%.
Invalidation: Stop ~689.17 (2x ATR) or daily close back below SMA50.
Continuation of the 2026-10-08 alert, not a new one — this is print 2 of one run: the same call went out on 2026-10-08. Today is not a fresh signal; the setup was already true when the desk last printed it. The analog below measures the first session of a run, so its hit rate belongs to 2026-10-08, not to today.
Same-setup analogs on 21 names (n=1020, n_eff=113.5, 95% CI 51–68%): 60% 21-session net hit rate against a 59% base rate, average +2.8%, vs SPY +1.5%.
The 95% interval includes 50%, so this is the desk's narrative setup rather than a demonstrated edge.
LLM wait at 62/100: Meta Platforms shows a standard pullback to its short-term moving average within a strong macro trend. However, sub-par relative volume and a lower composite score suggest it lacks immediate urgency compared to top-tier setups. It remains a viable watchlist candidate but does not demand immediate capital reallocation.
Risk: A drift below the 50-day moving average would turn the constructive pullback into a more concerning distribution phase.
Apple Inc. (AAPL)
Scanner what happened: AAPL closed near a 52-week high at 67/100 (setup 65).
Why it printed:
- Within 1.5% of 52-week high.
- Still in a bullish SMA regime.
- Beating SPY by 1.9% over 21d.
- VIX regime low.
Invalidation: Failed breakout if close back below prior 52w high and stop ~329.61.
Same-setup analogs on 21 names (n=738, n_eff=100.8, 95% CI 49–68%): 58% 21-session net hit rate against a 59% base rate, average +2.8%, vs SPY +1.8%.
The 95% interval includes 50%, so this is the desk's narrative setup rather than a demonstrated edge.
LLM confirm at 67/100: Apple prints a valid breakout setup hovering within striking distance of its 52-week high. Solid relative volume and positive relative strength confirm steady institutional demand. The low VIX regime provides a supportive backdrop for new highs.
Risk: A failed breakout resulting in a close back below the prior 52-week high invalidates the momentum trade.
Microsoft Corporation (MSFT)
Scanner what happened: MSFT pulled back to its 20-day average inside an uptrend at 63/100 (setup 60).
Why it printed:
- Price above SMA50 and SMA50 above SMA200 (bullish regime).
- VIX regime is low (15.27).
- 21d relative strength vs SPY is 5.7%.
- Relative volume 0.90x.
Invalidation: Stop ~510.57 (2x ATR) or daily close back below SMA50.
Same-setup analogs on 21 names (n=1020, n_eff=113.5, 95% CI 51–68%): 60% 21-session net hit rate against a 59% base rate, average +2.8%, vs SPY +1.5%.
The 95% interval includes 50%, so this is the desk's narrative setup rather than a demonstrated edge.
LLM wait at 63/100: Microsoft rests comfortably in a bullish moving average regime with acceptable relative strength. Sub-par relative volume of 0.90x indicates a lack of aggressive near-term buying pressure. The setup is sound, but current price action does not compel an immediate schedule adjustment.
Risk: Loss of the 50-day moving average would break the primary trendline support.
Applied Materials (AMAT)
Scanner what happened: AMAT sat in a deep drawdown during VIX stress at 62/100 (setup 58).
Why it printed:
- Close is -39.6% from the 52-week high — a deep drawdown.
- Drawdown reaches 35% from the high.
- Trailing P/E is 16% cheaper than the industry-peer median.
- TTM EPS is still growing through the drawdown (14.0% YoY).
Invalidation: Stop ~406.23 (2x ATR) or TTM earnings turning negative.
Same-setup analogs on 21 names (n=221, n_eff=58.2, 95% CI 50–74%): 63% 21-session net hit rate against a 59% base rate, average +3.6%, vs SPY +1.4%.
The 95% interval includes 50%, so this is the desk's narrative setup rather than a demonstrated edge.
LLM haircut at 62/100: Applied Materials exhibits a deep drawdown value setup with ongoing year-over-year earnings growth through the pullback. While valuation and earnings support the thesis, a lower composite score and moderate conviction reflect lingering downside pressure in the semiconductor equipment space. Treat as a secondary accumulation candidate.
Risk: Deteriorating semiconductor capital expenditure trends could threaten earnings stability and delay recovery.
NXP Semiconductors (NXPI)
Scanner what happened: NXPI sat in a deep drawdown during VIX stress at 62/100 (setup 58).
Why it printed:
- Close is -35.0% from the 52-week high — a deep drawdown.
- Drawdown reaches 35% from the high.
- Trailing P/E is 53% cheaper than the industry-peer median.
- TTM EPS is still growing through the drawdown (9.4% YoY).
Invalidation: Stop ~205.59 (2x ATR) or TTM earnings turning negative.
Same-setup analogs on 21 names (n=221, n_eff=58.2, 95% CI 50–74%): 63% 21-session net hit rate against a 59% base rate, average +3.6%, vs SPY +1.4%.
The 95% interval includes 50%, so this is the desk's narrative setup rather than a demonstrated edge.
LLM haircut at 62/100: NXP Semiconductors offers an aggressive valuation discount and positive fundamental earnings growth through a steep correction. However, negative 21-day relative strength highlights persistent selling pressure relative to the broader market. The valuation is attractive, but lack of momentum justifies a haircut.
Risk: Extended relative weakness could lead to further consolidation before any meaningful price bottom forms.
Overall: mixed hybrid tape. Read each card's scanner grade, LLM stance, and hybrid conviction separately — not as one market call.
RESEARCH ONLY — not advice.
Scanner names what happened on the tape. The model grades that observation. Hybrid conviction is what publishes. The model cannot add a name that did not fire. Research only — not a timing call.
add reminders
Five add reminders
Live add reminders: K1, K2, K3, K4, and K5. Exclusive listing, strongest first. K6, K7, K8, K9, and K10 repeat those shapes on the name's industry tape and can print on the same close. K11 and K12 are that name's own RSI and can print on the same close. Not a named setup. Does not score. Now vs 52w is close versus the 252-session high. This-name median is that same drawdown on this ticker's prior fires of the same gate.
Quiet today: K1 Weekly RSI (fear) · K2 Weekly RSI (elevated) · K3 Daily RSI (fear) · K4 Daily RSI (elevated) · K5 Daily RSI (calm) · K6 Weekly RSI (industry stress) · K7 Weekly RSI (industry elevated) · K8 Daily RSI (industry stress) · K9 Daily RSI (industry elevated) · K10 Daily RSI (industry calm) · K11 Weekly RSI · K12 Daily RSI.
Quiet watch: no desk name is approaching. VIX must already be 30.
NVDA NVDA traded cheaper than its industry peers on trailing P/E
Hybrid 93/100 · buy · named setup cheap vs industry
Scanner 93/100 LLM confirm 93/100
Nvidia presents a compelling cheap_vs_industry print, trading 23% below its semiconductor peer median P/E despite dominant scale. Positive 21-day relative strength against the S&P 500 confirms institutional sponsorship is intact during this consolidation phase. Repeated appearances across recent sessions highlight persistent accumulation.
Multiple re-rates up to the peer median P/E, or a daily close back below SMA200; stop ~209.64.
- Close
- 221.30
- vs SMA20
- -3.2%
- RSI 14
- 43.9
- Stop
- 209.64
Pattern readings
| Pattern | Current | Threshold | vs | Status |
|---|---|---|---|---|
| Historic drawdown | 7.5% | >= top-3 avg 53.3% | 0.14x | below |
| 20d range high | 221.30 | > 243.37 | -9.1% | below |
| 20d range low | 221.30 | < 212.50 | +4.1% | below |
| Relative volume | 1.05x | >= 1.50x expansion / <= 0.70x dry-up | 0.70x vs expansion | below |
| RSI_14 | 43.9 | oversold < 30 · reset 35-58 · overbought > 70 | mid 30-70 | inside |
| MACD vs signal | 1.977 vs 3.234 | cross up: line > signal after line <= signal | spread -1.258 | below |
| Bollinger squeeze | width 9.269 | <= 20%ile cutoff 11.107 | 0.83x cutoff | met |
| vs SMA20 (pullback tag) | -3.2% | -4.0% to +1.2% | -3.2% | met |
| vs 52w high (breakout) | -9.1% | >= -3.0% (within 3% of high) | -9.1% | below |
| SMA50 vs SMA200 | 223.21 vs 202.69 | golden: 50 > 200 · death: 50 < 200 | +10.1% | above |
| VIX | 15.27 (low) | elevated >= 20 · stress >= 30 | 15.27 | low |
Similar-setup analog
cheap vs industry onset · 266 samples · last 2300 sessions (publish window). What happened on similar days — not a forecast.
| Horizon | n | Hit rate | Base rate | Avg | vs SPY | Beat SPY |
|---|---|---|---|---|---|---|
| 5d | 266 | 57% | 55% | +0.9% | +0.5% | 56% |
| 10d | 265 | 59% | 56% | +1.9% | +0.8% | 52% |
| 21d | 263 | 58% | 59% | +3.1% | +1.3% | 53% |
| 63d | 260 | 65% | 63% | +9.7% | +5.7% | 58% |
| 126d | 251 | 68% | 68% | +17.8% | +10.4% | 59% |
Hit rate is shown next to the 21-session base rate so the comparison is unavoidable. The ~60% absolute up-rate is not an expected future return: the universe is today's winners chosen after the fact. Beat SPY is how often one trade finished ahead of the index; the SPY columns carry no trading cost because buying the index pays the same round trip.
4 more names behind the desk pass
- TSM cheap vs industry · 93/100
- TXN pullback in uptrend · 86/100
- AMZN cheap vs industry · 83/100
- MU cheap vs industry · 80/100
Print board
Discussion
0 notes on this close. Research talk, not advice.
Sign in to join the thread. Reading is open.
No notes yet. First take on this tape is open.