
Close print
2026-10-02
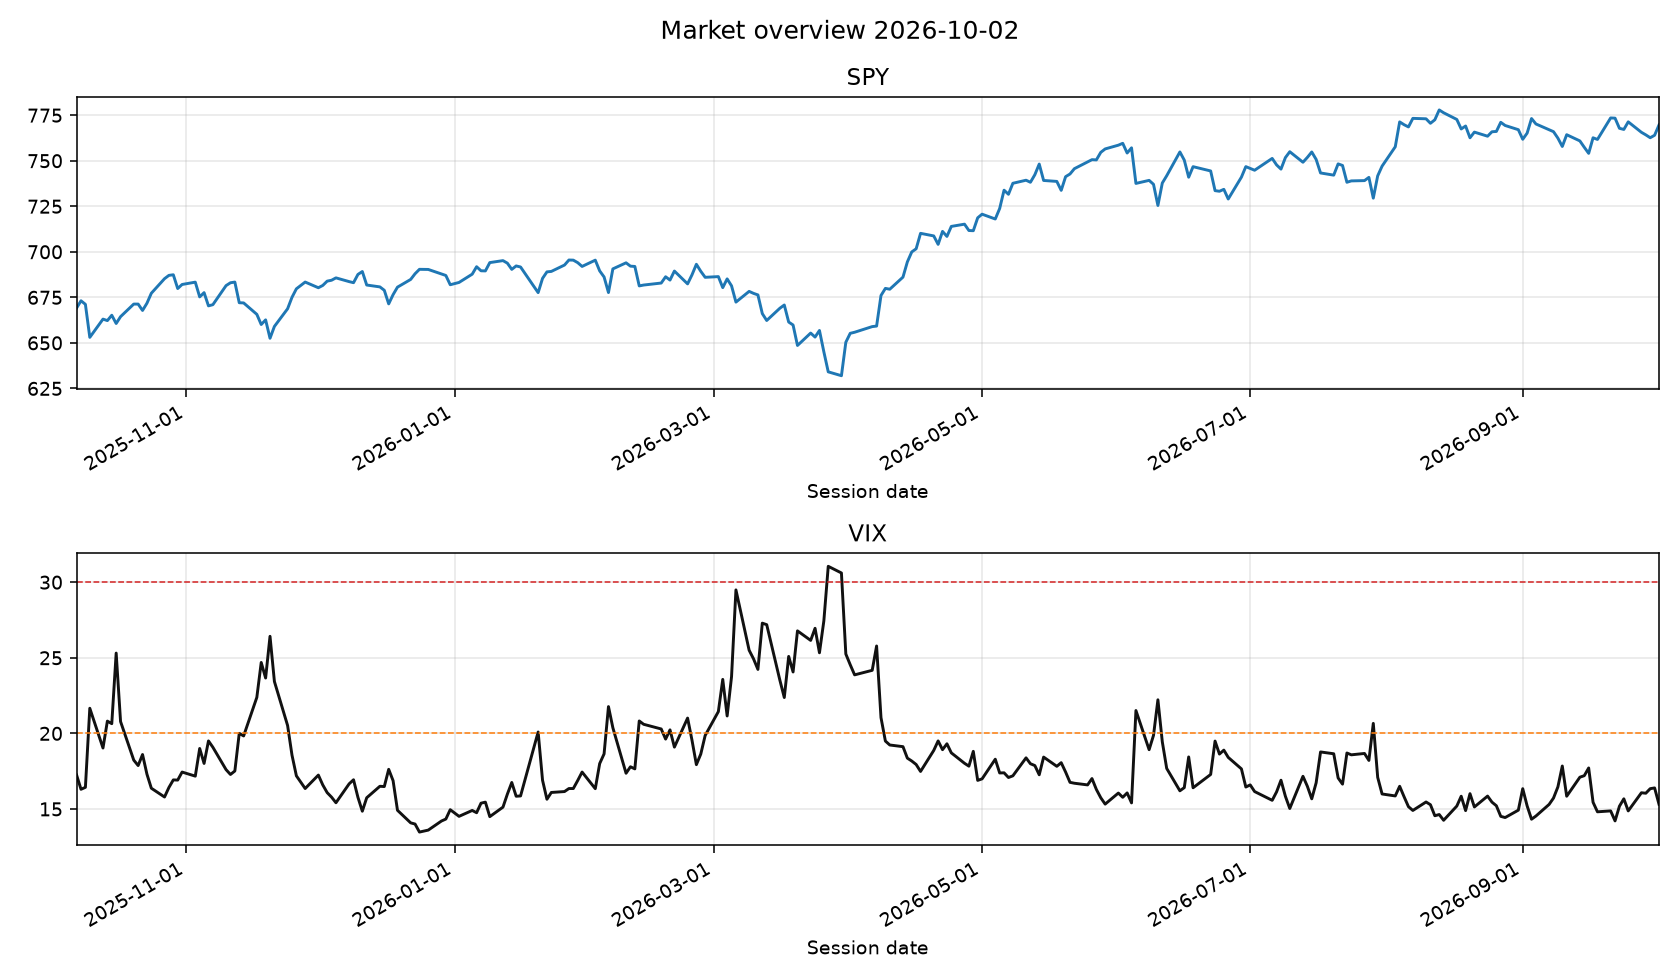
- VIX 15.31 low
- SPY 769.64
- 4 named setups
- Free teaser
Over the measured window — ten years of the local tape, 21 names, onsets spaced so one market phase counts once, and a 10 bps round trip — no named setup beat holding these companies. The unconditional 21-session up-rate was 58.67%. On buy-now versus wait through the next 21 sessions, every setup landed between −0.67% and +0.64% against a random session. One setup clears the publish gate: historic_drawdown at a 61.25% net hit rate on 352 onsets, and its 95% interval bottoms out at 50.33% — a third of a point above a coin. Read that as a gate it passed, not an edge it demonstrated. The desk publishes named setups as context — what happened on the tape — not as timing calls. Scheduled accumulation is the default the evidence supports. The 58.67% figure is not an expected future return: the universe is today's survivors chosen after the fact, which inflates the absolute up-rate.
Desk take
What we think of this print
Close print for 2026-10-02. VIX 15.31 (low) and SPY 769.64 set the tape. Hybrid desk: the scanner names the setup, the model grades that same print, and published conviction is the blend. The model cannot add a name that did not fire.
NVIDIA Corporation (NVDA): scanner what happened — NVDA traded cheaper than its industry peers on trailing P/E at 100/100 (setup 100). Why it printed: Trailing P/E 33.4 is below the semiconductors peer median 43.7 (24% cheaper).; Market cap still sits above the peer median ($5.65T vs $1.03T).; Cap is more than 2× the peer median — quality/size filter.; VIX regime is low (15.31).; 21d relative strength vs SPY is 3.7%.; Relative volume 1.23x.. Invalidation: Multiple re-rates up to the peer median P/E, or a daily close back below SMA200; stop ~222.13.. Same-setup analogs on 21 names (n=171, n_eff=77.0, 95% CI 47–68%) show a 58% 21-session net hit rate against a 59% base rate, average +3.8%, vs SPY +2.1%. The 95% interval includes 50%, so this is the desk's narrative setup rather than a demonstrated edge. LLM haircut at 94/100: RSI is firm, not a reset — haircut versus the scanner grade. Risk: Multiple re-rates up to the peer median P/E, or a daily close back below SMA200; stop ~222.13..
Micron Technology (MU): scanner what happened — MU traded cheaper than its industry peers on trailing P/E at 98/100 (setup 98). Why it printed: Trailing P/E 14.2 is below the semiconductors peer median 77.1 (82% cheaper).; Market cap still sits above the peer median ($1.21T vs $832.8B).; VIX regime is low (15.31).; 21d relative strength vs SPY is 11.8%.; Relative volume 1.03x.. Invalidation: Multiple re-rates up to the peer median P/E, or a daily close back below SMA200; stop ~981.92.. Same-setup analogs on 21 names (n=171, n_eff=77.0, 95% CI 47–68%) show a 58% 21-session net hit rate against a 59% base rate, average +3.8%, vs SPY +2.1%. The 95% interval includes 50%, so this is the desk's narrative setup rather than a demonstrated edge. LLM confirm at 98/100: Analogs and RSI both support a reset rather than a chase. Risk: Multiple re-rates up to the peer median P/E, or a daily close back below SMA200; stop ~981.92..
Apple Inc. (AAPL): scanner what happened — AAPL pulled back to its 20-day average inside an uptrend at 88/100 (setup 85). Why it printed: Price above SMA50 and SMA50 above SMA200 (bullish regime).; VIX regime is low (15.31).; RSI_14=54.7 is a reset, not a chase.; Close is 0.5% from SMA20 (pullback/tag).; 21d relative strength vs SPY is 2.1%.. Invalidation: Stop ~319.62 (2x ATR) or daily close back below SMA50.. Same-setup analogs on 21 names (n=1020, n_eff=113.6, 95% CI 50–68%) show a 59% 21-session net hit rate against a 59% base rate, average +2.7%, vs SPY +1.4%. The 95% interval includes 50%, so this is the desk's narrative setup rather than a demonstrated edge. LLM confirm at 88/100: Analogs and RSI both support a reset rather than a chase. Risk: Stop ~319.62 (2x ATR) or daily close back below SMA50..
Qualcomm (QCOM): scanner what happened — QCOM pulled back to its 20-day average inside an uptrend at 88/100 (setup 85). Why it printed: Price above SMA50 and SMA50 above SMA200 (bullish regime).; VIX regime is low (15.31).; RSI_14=52.4 is a reset, not a chase.; Close is -0.2% from SMA20 (pullback/tag).; 21d relative strength vs SPY is 8.2%.. Invalidation: Stop ~168.17 (2x ATR) or daily close back below SMA50.. Same-setup analogs on 21 names (n=1020, n_eff=113.6, 95% CI 50–68%) show a 59% 21-session net hit rate against a 59% base rate, average +2.7%, vs SPY +1.4%. The 95% interval includes 50%, so this is the desk's narrative setup rather than a demonstrated edge. LLM confirm at 88/100: Analogs and RSI both support a reset rather than a chase. Risk: Stop ~168.17 (2x ATR) or daily close back below SMA50..
Applied Materials (AMAT): scanner what happened — AMAT pulled back to its 20-day average inside an uptrend at 77/100 (setup 70). Why it printed: Price above SMA50 and SMA50 above SMA200 (bullish regime).; VIX regime is low (15.31).; 21d relative strength vs SPY is 22.6%.; Relative volume 0.96x.; Bullish RSI/MACD divergence lines up with the pullback.. Invalidation: Stop ~500.98 (2x ATR) or daily close back below SMA50.. Same-setup analogs on 21 names (n=1020, n_eff=113.6, 95% CI 50–68%) show a 59% 21-session net hit rate against a 59% base rate, average +2.7%, vs SPY +1.4%. The 95% interval includes 50%, so this is the desk's narrative setup rather than a demonstrated edge. LLM haircut at 71/100: RSI is firm, not a reset — haircut versus the scanner grade. Risk: Stop ~500.98 (2x ATR) or daily close back below SMA50..
KLA (KLAC): scanner what happened — KLAC printed a bullish divergence at 74/100 (setup 66). Why it printed: RSI_14 regular bullish divergence.; Still a bullish SMA regime, so this is a reset not a falling knife.; VIX regime low.. Invalidation: Stop ~191.61 or a new closing low under the divergence trough.. Same-setup analogs on 21 names (n=119, n_eff=49.5, 95% CI 41–67%) show a 54% 21-session net hit rate against a 59% base rate, average +3.3%, vs SPY +2.1%. The 95% interval includes 50%, so this is the desk's narrative setup rather than a demonstrated edge. LLM haircut at 68/100: RSI is firm, not a reset — haircut versus the scanner grade. Risk: Stop ~191.61 or a new closing low under the divergence trough..
Advanced Micro Devices (AMD): scanner what happened — AMD closed near a 52-week high at 73/100 (setup 65). Why it printed: Within 1.8% of 52-week high.; Still in a bullish SMA regime.; Beating SPY by 38.1% over 21d.; VIX regime low.. Invalidation: Failed breakout if close back below prior 52w high and stop ~585.49.. Same-setup analogs on 21 names (n=742, n_eff=101.1, 95% CI 48–67%) show a 58% 21-session net hit rate against a 59% base rate, average +2.8%, vs SPY +1.8%. The 95% interval includes 50%, so this is the desk's narrative setup rather than a demonstrated edge. LLM wait at 62/100: RSI is stretched; the setup fired but this still looks like a chase. Risk: Failed breakout if close back below prior 52w high and stop ~585.49..
Taiwan Semiconductor (TSM): scanner what happened — TSM closed near a 52-week high at 73/100 (setup 65). Why it printed: Within 1.3% of 52-week high.; Still in a bullish SMA regime.; Beating SPY by 13.2% over 21d.; VIX regime low.. Invalidation: Failed breakout if close back below prior 52w high and stop ~451.56.. Same-setup analogs on 21 names (n=742, n_eff=101.1, 95% CI 48–67%) show a 58% 21-session net hit rate against a 59% base rate, average +2.8%, vs SPY +1.8%. The 95% interval includes 50%, so this is the desk's narrative setup rather than a demonstrated edge. LLM wait at 62/100: RSI is stretched; the setup fired but this still looks like a chase. Risk: Failed breakout if close back below prior 52w high and stop ~451.56..
Microsoft Corporation (MSFT): scanner what happened — MSFT pulled back to its 20-day average inside an uptrend at 70/100 (setup 60). Why it printed: Price above SMA50 and SMA50 above SMA200 (bullish regime).; VIX regime is low (15.31).; 21d relative strength vs SPY is 3.6%.; Relative volume 0.84x.. Invalidation: Stop ~494.36 (2x ATR) or daily close back below SMA50.. Continuation of the 2026-09-11 alert, not a new one — this is print 2 of one run: the same call went out on 2026-09-11. Today is not a fresh signal; the setup was already true when the desk last printed it. The analog below measures the first session of a run, so its hit rate belongs to 2026-09-11, not to today. Same-setup analogs on 21 names (n=1020, n_eff=113.6, 95% CI 50–68%) show a 59% 21-session net hit rate against a 59% base rate, average +2.7%, vs SPY +1.4%. The 95% interval includes 50%, so this is the desk's narrative setup rather than a demonstrated edge. LLM haircut at 64/100: RSI is firm, not a reset — haircut versus the scanner grade. Risk: Stop ~494.36 (2x ATR) or daily close back below SMA50..
ASML Holding (ASML): scanner what happened — ASML pulled back to its 20-day average inside an uptrend at 70/100 (setup 60). Why it printed: Price above SMA50 and SMA50 above SMA200 (bullish regime).; VIX regime is low (15.31).; 21d relative strength vs SPY is 10.4%.; Relative volume 0.99x.. Invalidation: Stop ~1765.28 (2x ATR) or daily close back below SMA50.. Same-setup analogs on 21 names (n=1020, n_eff=113.6, 95% CI 50–68%) show a 59% 21-session net hit rate against a 59% base rate, average +2.7%, vs SPY +1.4%. The 95% interval includes 50%, so this is the desk's narrative setup rather than a demonstrated edge. LLM haircut at 64/100: RSI is firm, not a reset — haircut versus the scanner grade. Risk: Stop ~1765.28 (2x ATR) or daily close back below SMA50..
Intel (INTC): scanner what happened — INTC pulled back to its 20-day average inside an uptrend at 70/100 (setup 60). Why it printed: Price above SMA50 and SMA50 above SMA200 (bullish regime).; VIX regime is low (15.31).; 21d relative strength vs SPY is 31.9%.; Relative volume 0.85x.. Invalidation: Stop ~107.04 (2x ATR) or daily close back below SMA50.. Same-setup analogs on 21 names (n=1020, n_eff=113.6, 95% CI 50–68%) show a 59% 21-session net hit rate against a 59% base rate, average +2.7%, vs SPY +1.4%. The 95% interval includes 50%, so this is the desk's narrative setup rather than a demonstrated edge. LLM confirm at 70/100: Scanner structure and tape line up. This is still a research print, not a forecast. Risk: Stop ~107.04 (2x ATR) or daily close back below SMA50..
Marvell Technology (MRVL): scanner what happened — MRVL pulled back to its 20-day average inside an uptrend at 70/100 (setup 60). Why it printed: Price above SMA50 and SMA50 above SMA200 (bullish regime).; VIX regime is low (15.31).; 21d relative strength vs SPY is 31.3%.; Relative volume 0.90x.. Invalidation: Stop ~246.28 (2x ATR) or daily close back below SMA50.. Same-setup analogs on 21 names (n=1020, n_eff=113.6, 95% CI 50–68%) show a 59% 21-session net hit rate against a 59% base rate, average +2.7%, vs SPY +1.4%. The 95% interval includes 50%, so this is the desk's narrative setup rather than a demonstrated edge. LLM haircut at 64/100: RSI is firm, not a reset — haircut versus the scanner grade. Risk: Stop ~246.28 (2x ATR) or daily close back below SMA50..
Lam Research (LRCX): scanner what happened — LRCX pulled back to its 20-day average inside an uptrend at 66/100 (setup 55). Why it printed: Price above SMA50 and SMA50 above SMA200 (bullish regime).; VIX regime is low (15.31).; 21d relative strength vs SPY is 19.9%.. Invalidation: Stop ~319.81 (2x ATR) or daily close back below SMA50.. Same-setup analogs on 21 names (n=1020, n_eff=113.6, 95% CI 50–68%) show a 59% 21-session net hit rate against a 59% base rate, average +2.7%, vs SPY +1.4%. The 95% interval includes 50%, so this is the desk's narrative setup rather than a demonstrated edge. LLM haircut at 60/100: RSI is firm, not a reset — haircut versus the scanner grade. Risk: Stop ~319.81 (2x ATR) or daily close back below SMA50..
Overall: mixed hybrid tape. Read each card's scanner grade, LLM stance, and hybrid conviction separately — not as one market call.
RESEARCH ONLY — not advice.
Scanner names what happened on the tape. The model grades that observation. Hybrid conviction is what publishes. The model cannot add a name that did not fire. Research only — not a timing call.
add reminders
Five add reminders
Live add reminders. Exclusive listing, strongest first. Not a named setup. Does not score. Now vs 52w is close versus the 252-session high. This-name median is that drawdown on this ticker's prior fires of the same gate.
Quiet today: K1 Weekly RSI (fear) · K2 Weekly RSI (elevated) · K3 Daily RSI (fear) · K4 Daily RSI (elevated) · K5 Daily RSI (calm) · K6 Weekly RSI (industry stress) · K7 Weekly RSI (industry elevated) · K8 Daily RSI (industry stress) · K9 Daily RSI (industry elevated) · K10 Daily RSI (industry calm) · K11 Weekly RSI · K12 Daily RSI.
Quiet watch: no desk name is approaching. VIX must already be 30.
MU MU traded cheaper than its industry peers on trailing P/E
Hybrid 98/100 · buy · named setup cheap vs industry
Scanner 98/100 LLM confirm 98/100
Analogs and RSI both support a reset rather than a chase.
Multiple re-rates up to the peer median P/E, or a daily close back below SMA200; stop ~981.92.
- Close
- 1,074.89
- vs SMA20
- +4.9%
- RSI 14
- 59.3
- Stop
- 981.92
Pattern readings
| Pattern | Current | Threshold | vs | Status |
|---|---|---|---|---|
| Historic drawdown | 11.4% | >= top-3 avg 53.8% | 0.21x | below |
| 20d range high | 1074.89 | > 1108.72 | -3.1% | below |
| 20d range low | 1074.89 | < 902.60 | +19.1% | below |
| Relative volume | 1.03x | >= 1.50x expansion / <= 0.70x dry-up | 0.69x vs expansion | below |
| RSI_14 | 59.3 | oversold < 30 · reset 35-58 · overbought > 70 | mid 30-70 | inside |
| MACD vs signal | 35.286 vs 31.228 | cross up: line > signal after line <= signal | spread 4.058 | above |
| Bollinger squeeze | width 21.887 | <= 20%ile cutoff 21.628 | 1.01x cutoff | below |
| vs SMA20 (pullback tag) | +4.9% | -4.0% to +1.2% | +4.9% | outside |
| vs 52w high (breakout) | -14.4% | >= -3.0% (within 3% of high) | -14.4% | below |
| SMA50 vs SMA200 | 956.05 vs 681.61 | golden: 50 > 200 · death: 50 < 200 | +40.3% | above |
| VIX | 15.31 (low) | elevated >= 20 · stress >= 30 | 15.31 | low |
Similar-setup analog
cheap vs industry onset · 171 samples · last 2300 sessions (publish window). What happened on similar days — not a forecast.
| Horizon | n | Hit rate | Base rate | Avg | vs SPY | Beat SPY |
|---|---|---|---|---|---|---|
| 5d | 170 | 56% | 55% | +1.2% | +0.8% | 57% |
| 10d | 170 | 58% | 56% | +2.2% | +1.4% | 55% |
| 21d | 170 | 58% | 59% | +3.8% | +2.1% | 54% |
| 63d | 169 | 64% | 63% | +11.8% | +7.7% | 59% |
| 126d | 163 | 66% | 68% | +20.1% | +12.8% | 60% |
Hit rate is shown next to the 21-session base rate so the comparison is unavoidable. The ~60% absolute up-rate is not an expected future return: the universe is today's winners chosen after the fact. Beat SPY is how often one trade finished ahead of the index; the SPY columns carry no trading cost because buying the index pays the same round trip.
3 more names behind the desk pass
- NVDA cheap vs industry · 97/100
- AAPL pullback in uptrend · 88/100
- QCOM pullback in uptrend · 88/100
Print board
Discussion
0 notes on this close. Research talk, not advice.
Sign in to join the thread. Reading is open.
No notes yet. First take on this tape is open.